Statistical & Scientific Figures
A compilation of figures I’ve created for professional audiences.
These figures have been published in scientific journals, such as IEEE TVCG, ACM ToCHI, and CG&A. While their content is more technical than my journalism work, I endeavor to make them graspable to a wide audience.
I use Python and R for data analysis, and then edit resultant figures with Adobe Illustrator or Figma. Occasionally, I build responsive figures from scratch with D3.js. I build all of my assets from the ground up without AI, so that licensing and copyright is straightforward.
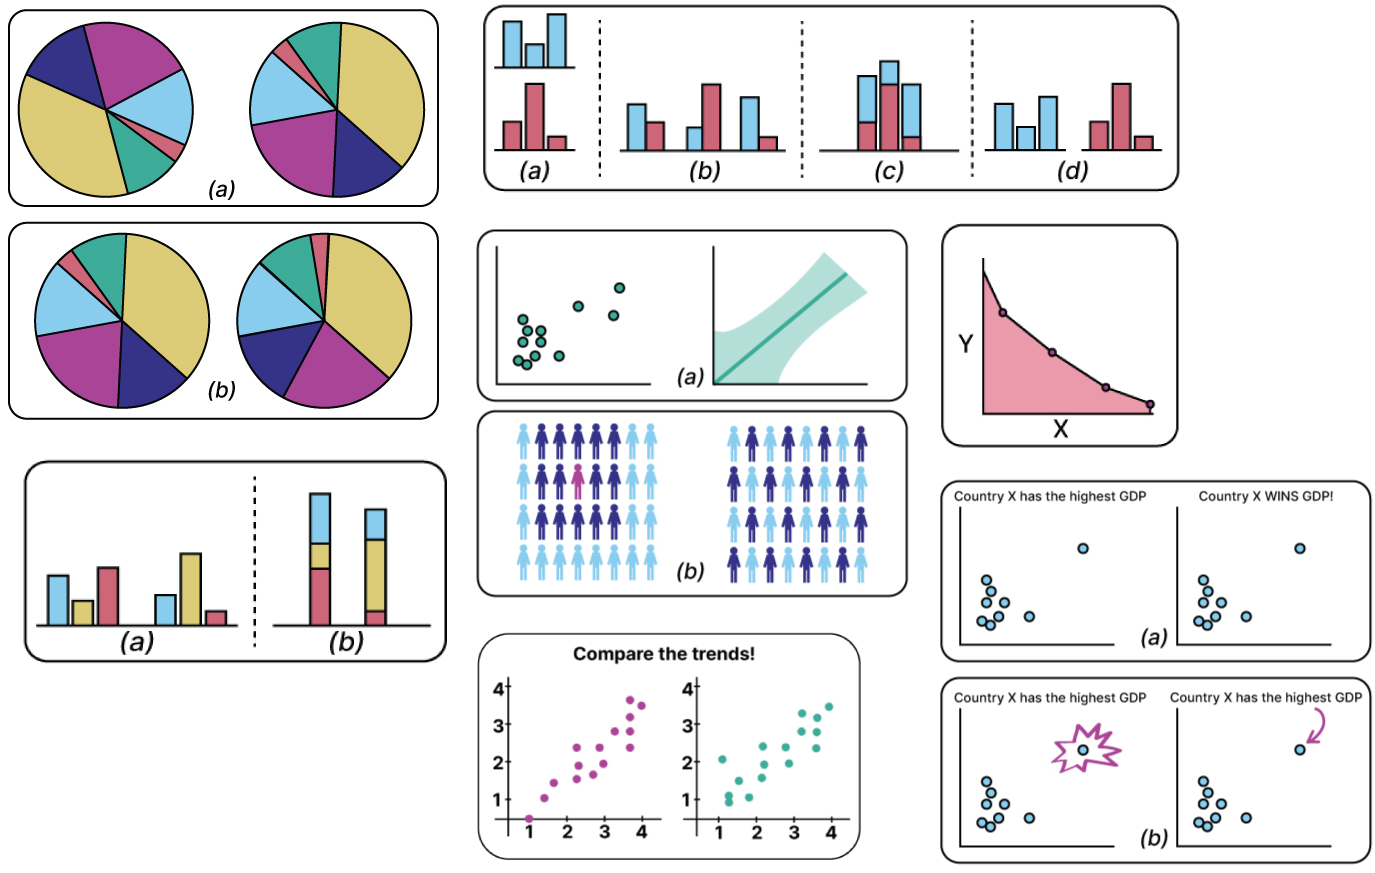
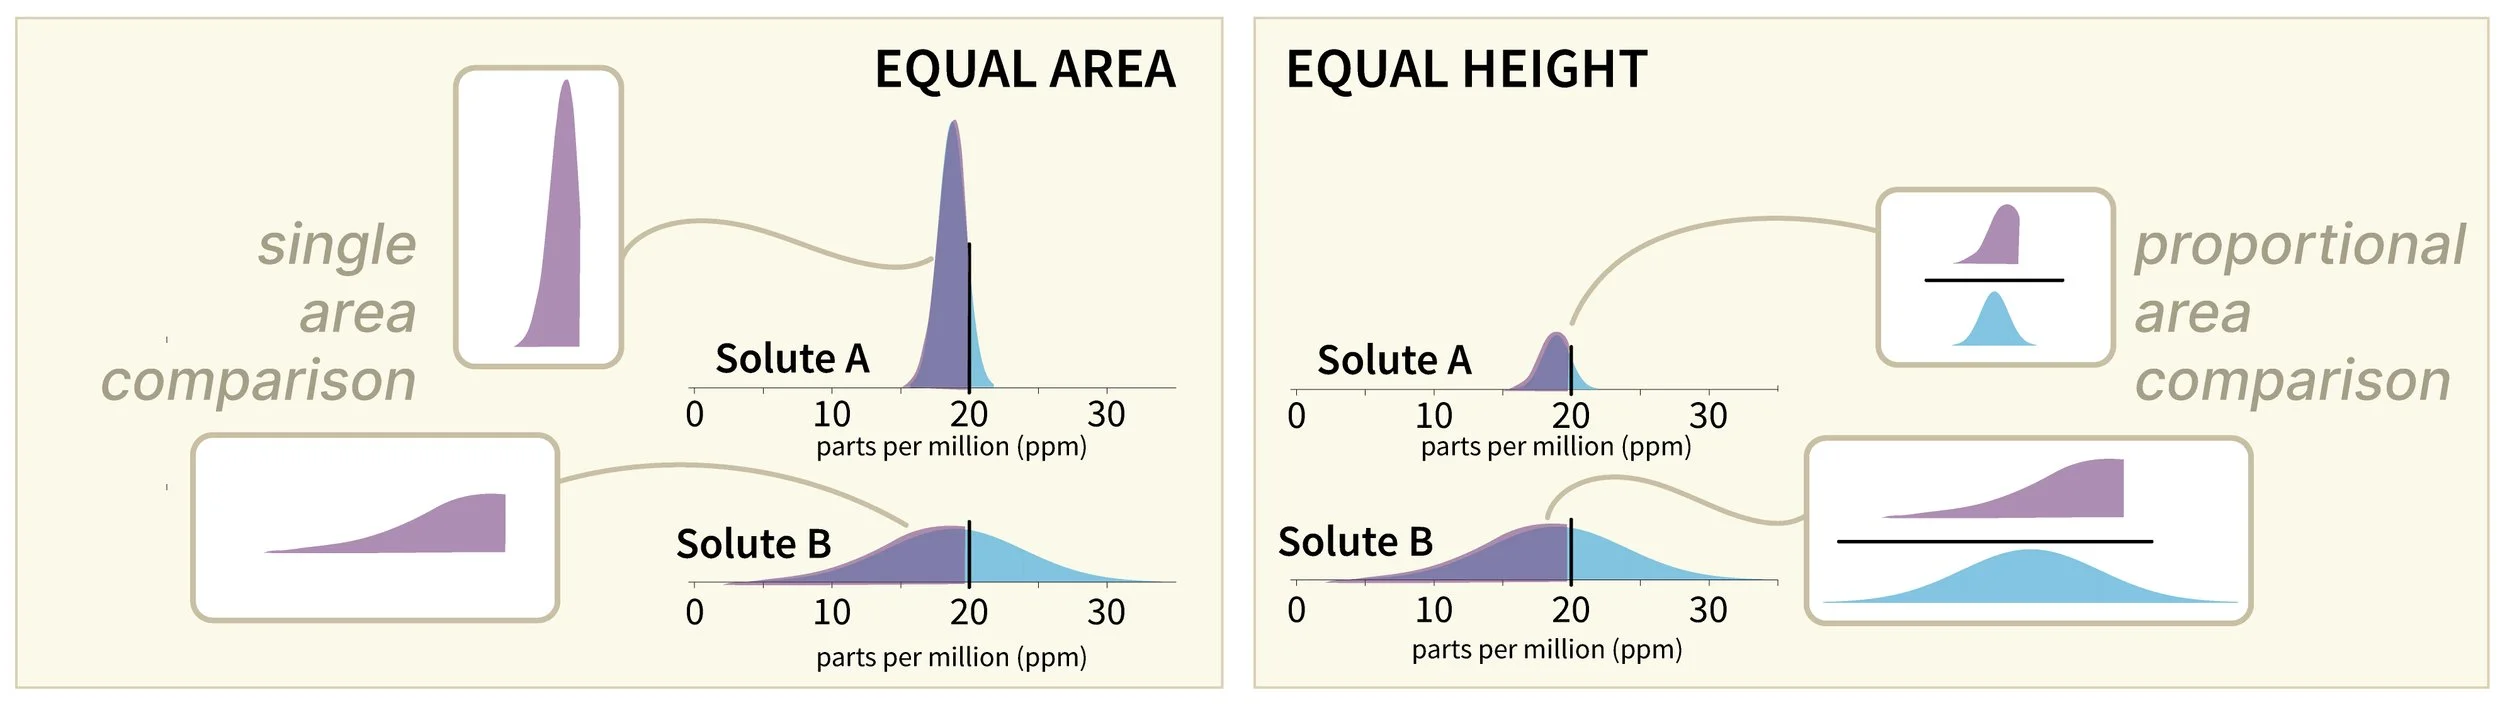
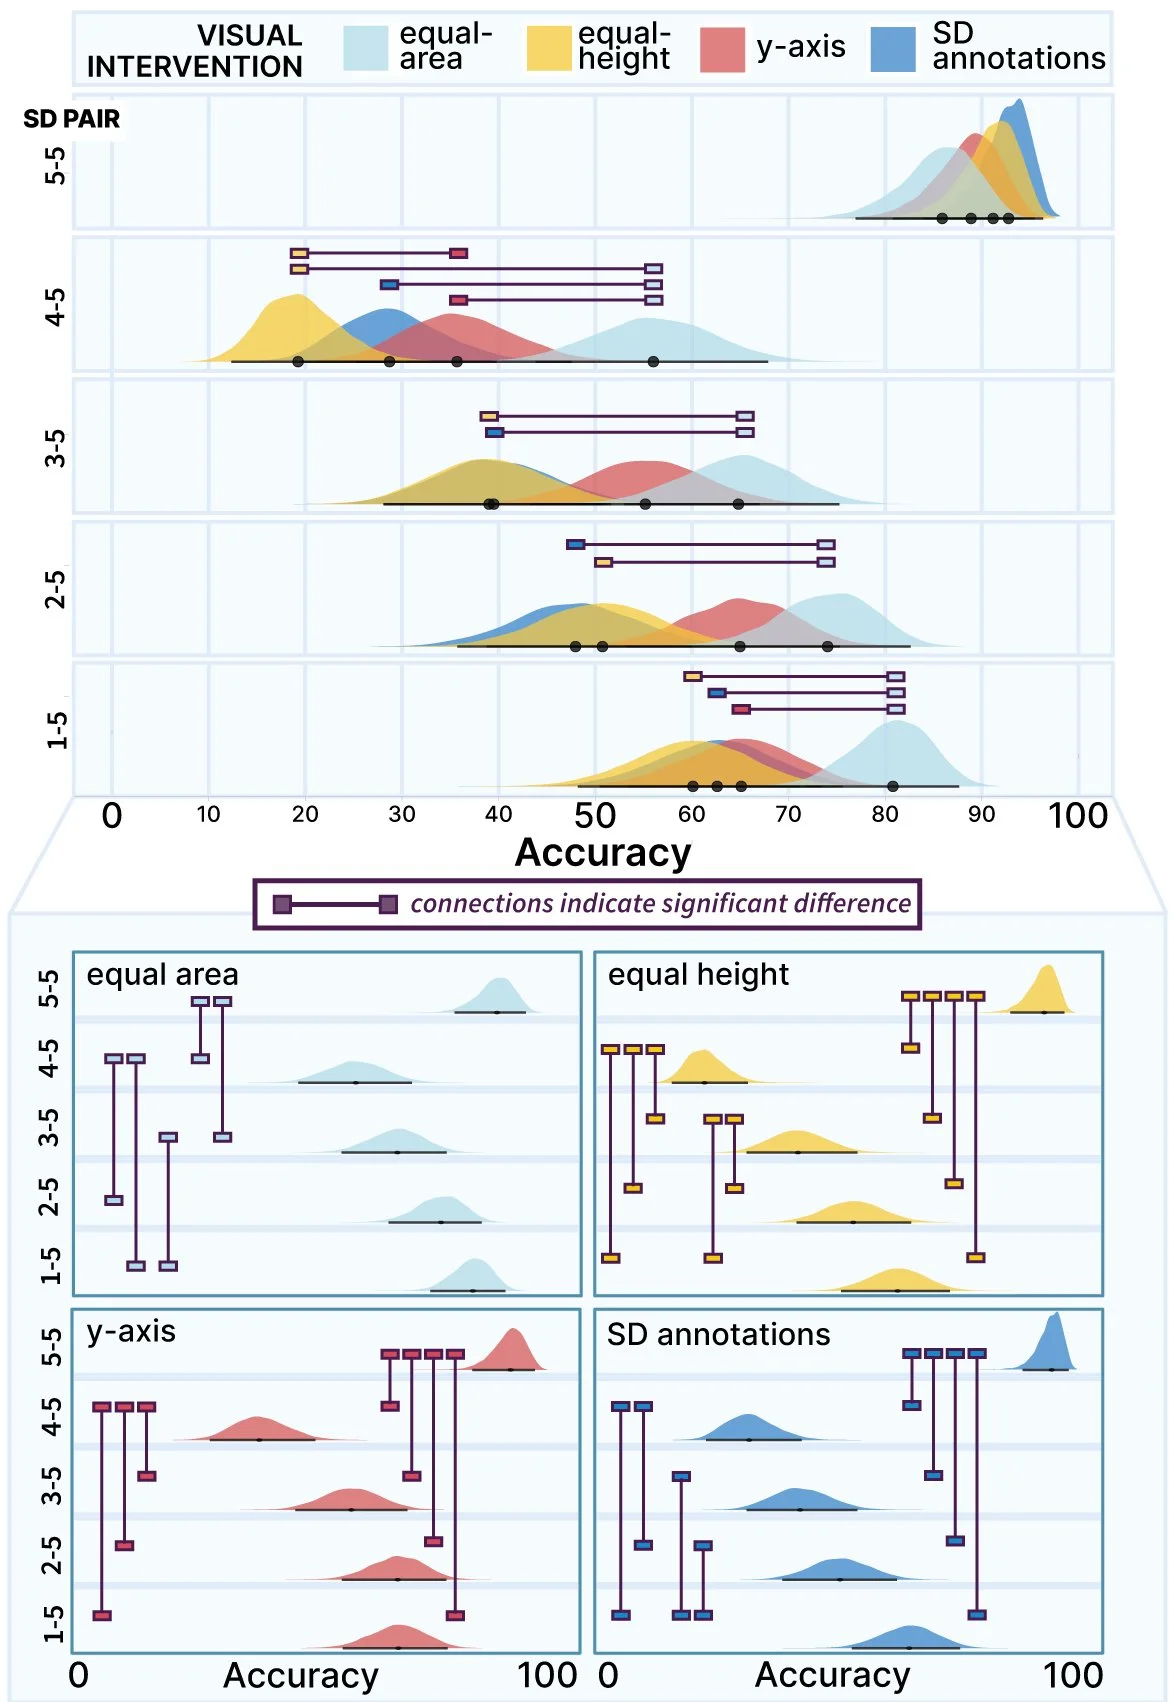
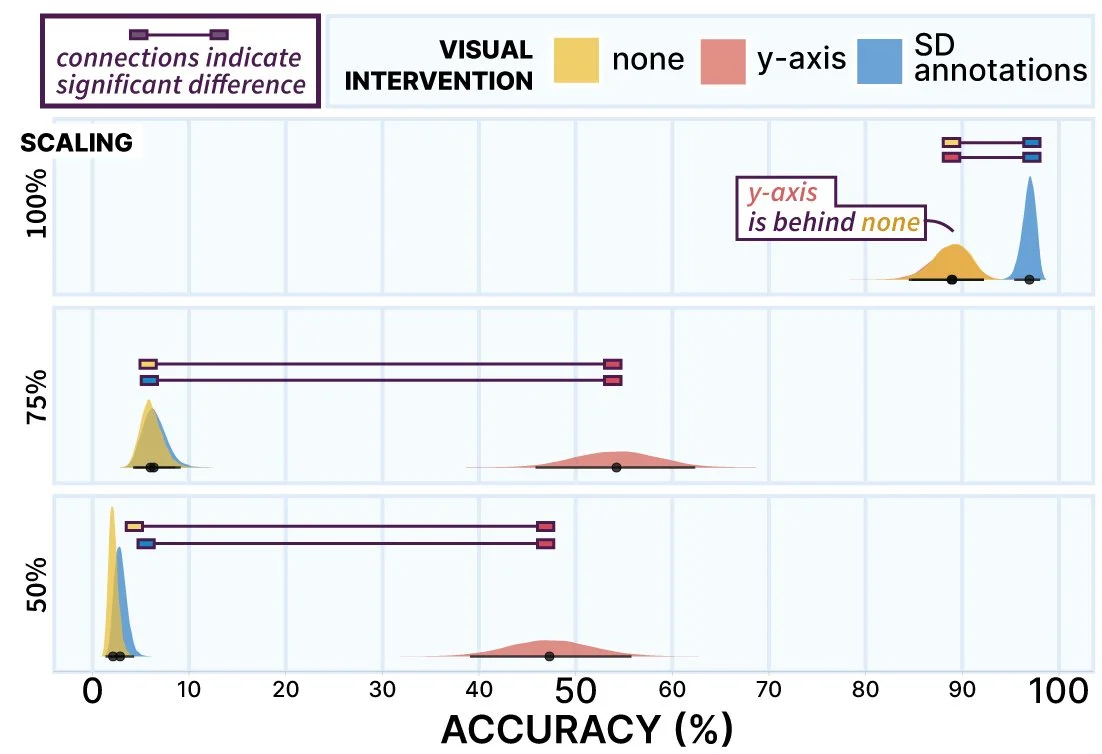
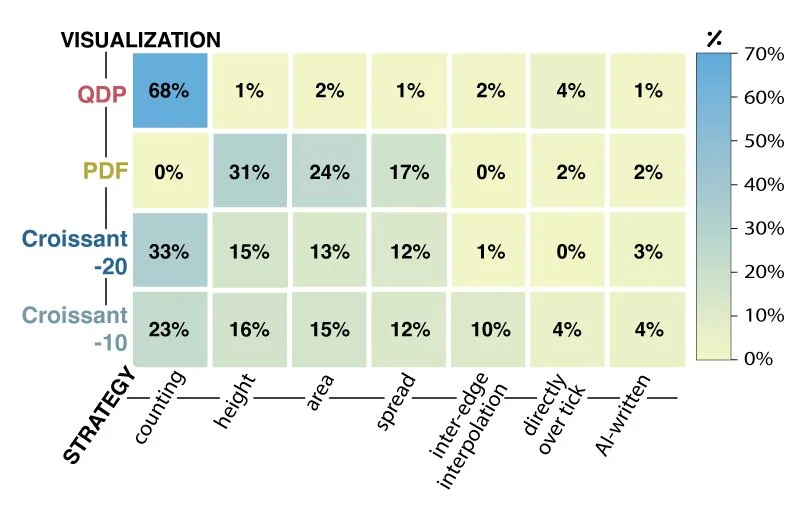
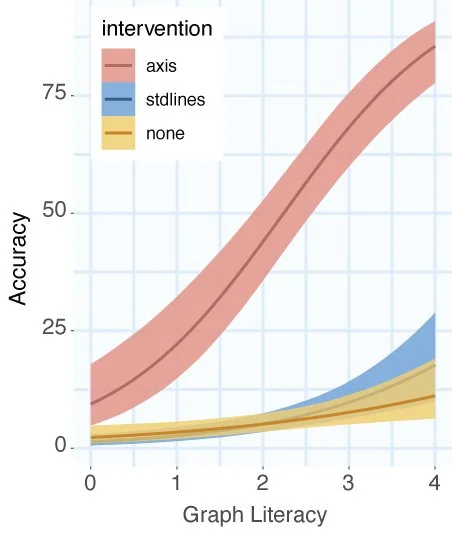
Statistical Results.
Examples of quantitative result figures, including confidence intervals, probability density functions, and heat maps.
Caption: Bayesian posteriors of accuracy as determined by SD Pairs, and Visual Interventions (colors). Rectangular connectors indicate comparisons where the credible interval do not include zero within and across SD Pairs and Visual Interventions.
Caption: Bayesian posteriors of accuracy as determined by scaling of PDF plots (rows) and visual interventions (colors).It All Begins Here
Caption: Percent of each visualization that led to each strategy (columns) across tested visualizations (rows). Strategies are not mutually exclusive so rows and columns may not equal 100%.
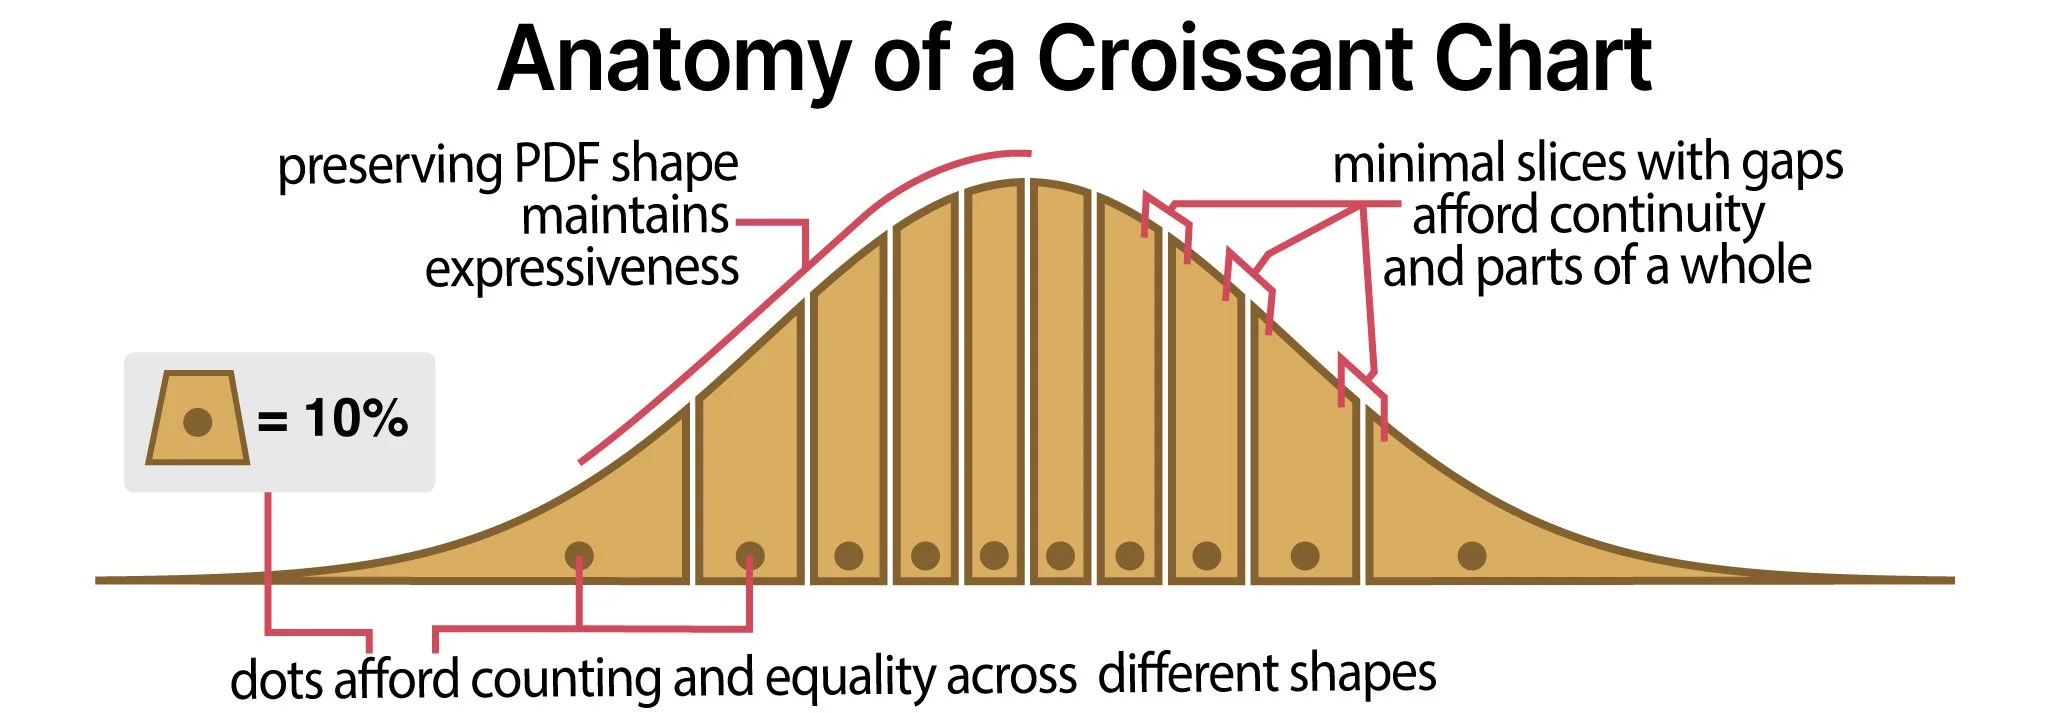
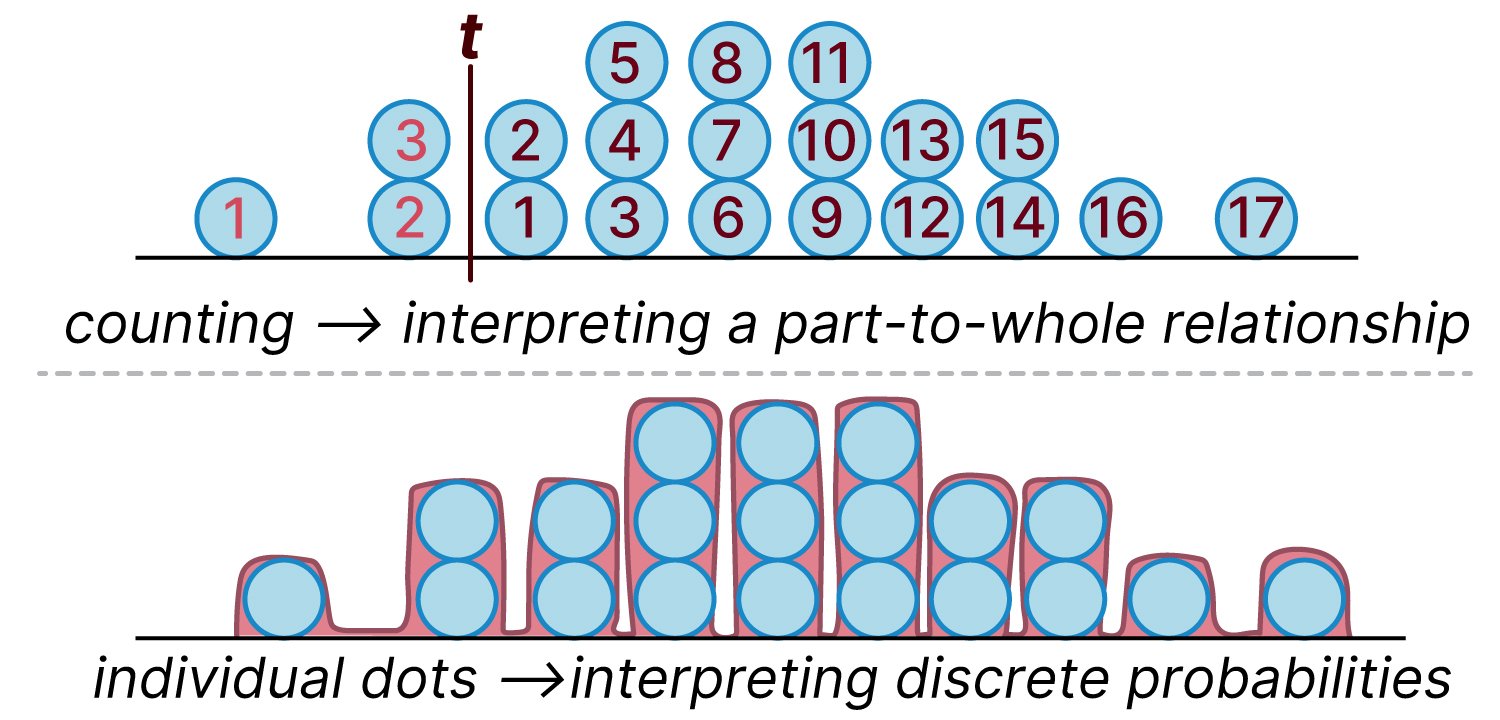
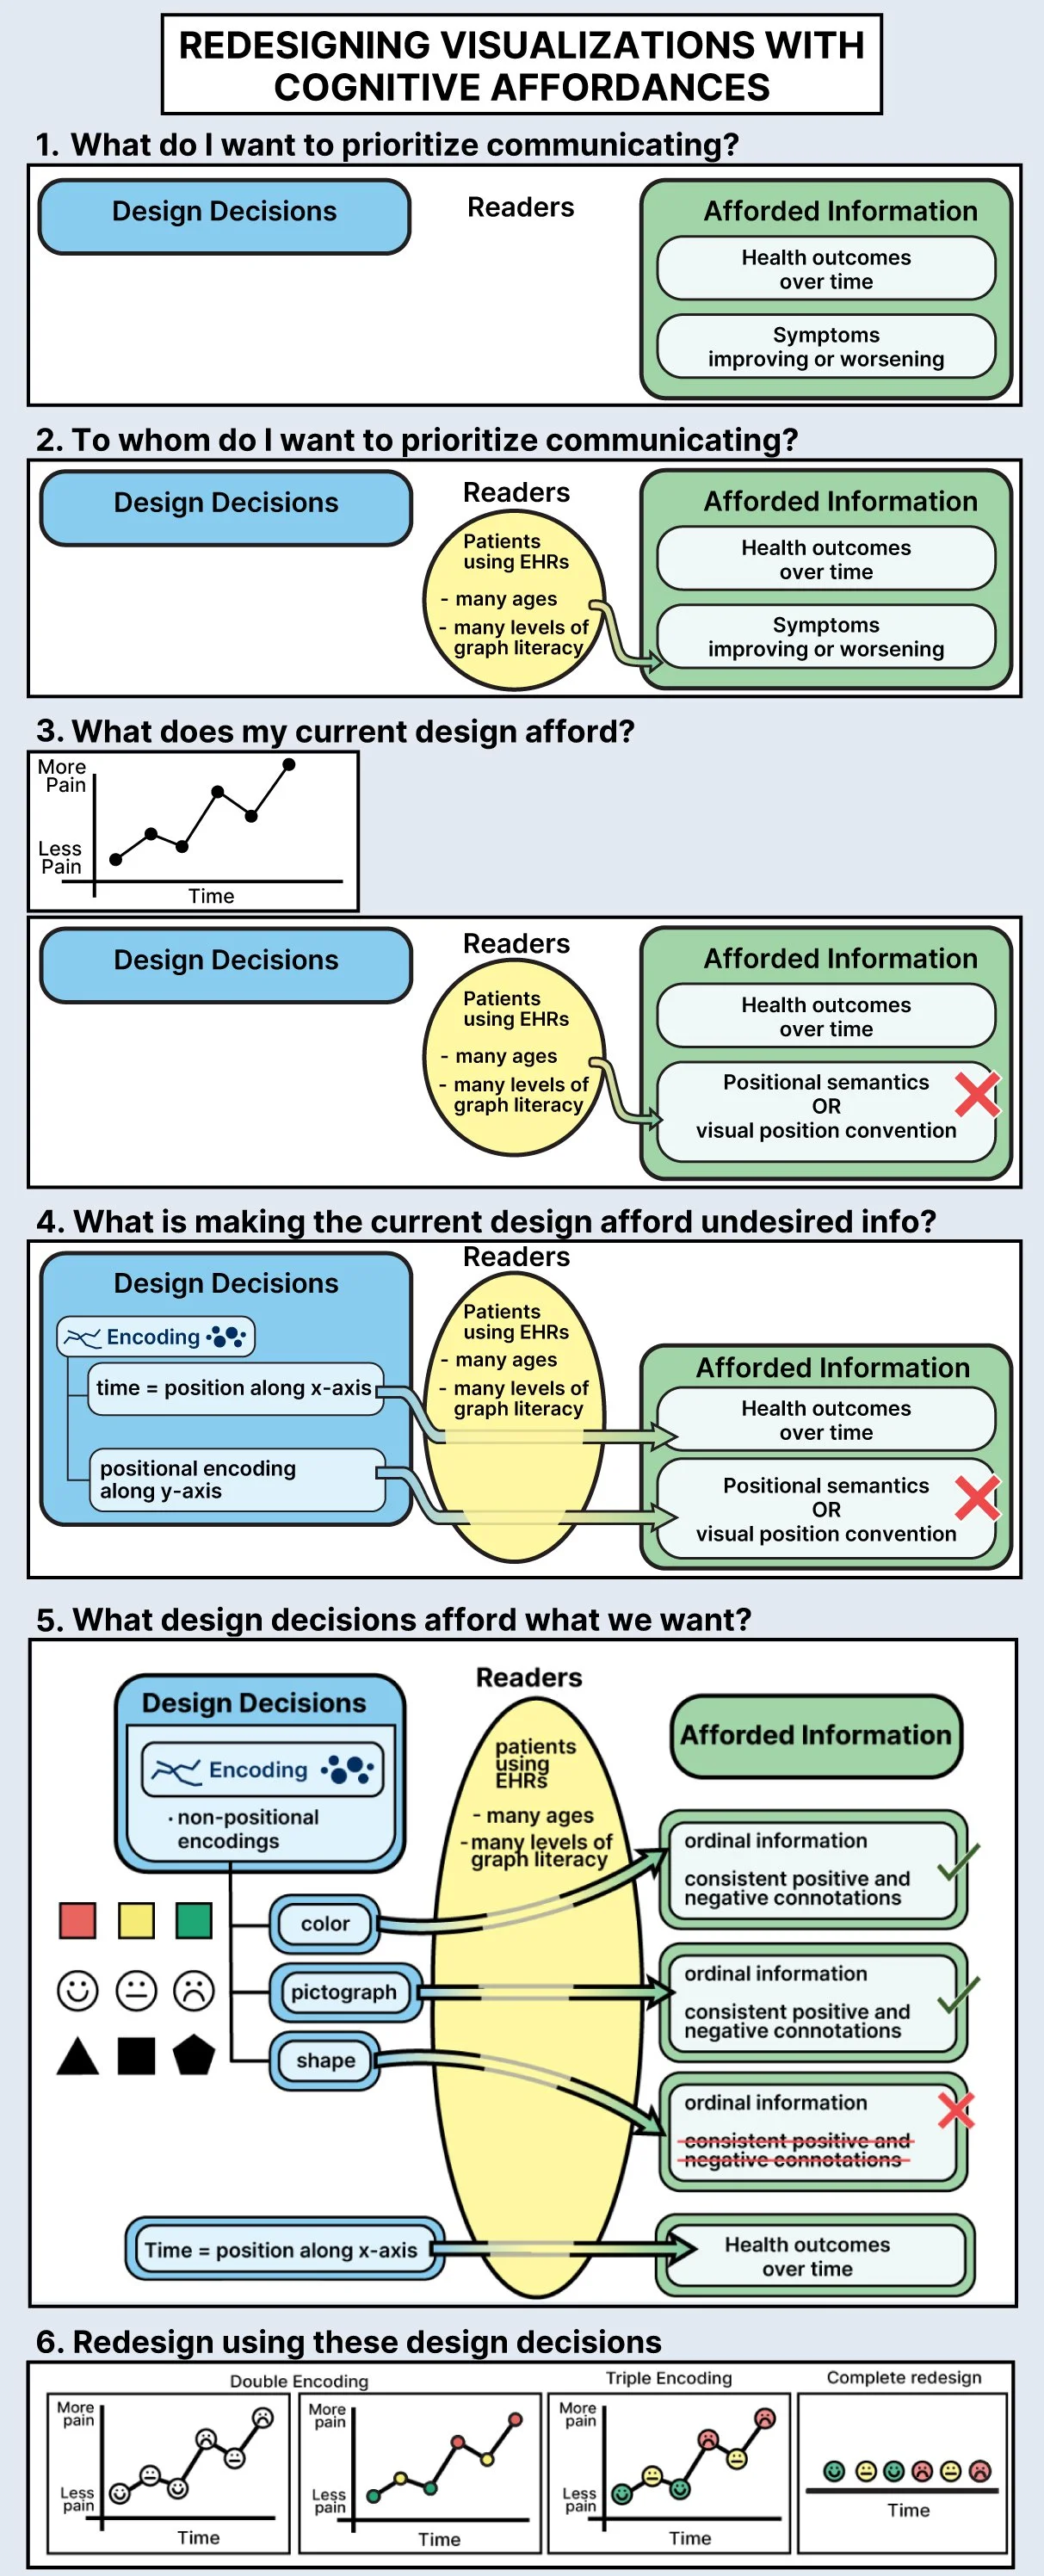
Explanatory Figures.
Examples of diagrams and illustrations that convey complex concepts through visual abstraction.
Caption: Croissant charts’ intended affordances. PDF shape for expressiveness. Minimal slices with gaps afford continuity and parts of a whole. Dots afford counting and equality across slices.
Caption: Correct visual strategies for comparing cumulative probabilities of two PDFs. Left: Equal-area PDF plots can be compared via a single area comparison. Right: Equal-height PDF plots must be compared via a proportional area comparison.
Caption: Workflow for examining and re-designing a visualization using cognitive affordances. In steps 1 and 2, a designer populates the cognitive affordance framework with their communication goals and target audience. In step 3, the designer uses investigative methods or past research to determine what their current visualization affords. In step 4, the designer identifies undesired information that their visualization communicates and uses cognitive affordances to trace the information back to root design decisions. In step 5, the designer uses cognitive affordances to hypothesize about the likely communication of alternate design decisions. In step 6, the designer implements visualization redesigns using step 5’s identified encodings.